We head into our fifteenth week of crowdfunding pledges tracking above better than the average amount of pledges raised. The total amount pledged continues to trend at a steady pace since we’ve started tracking the beginning of April.
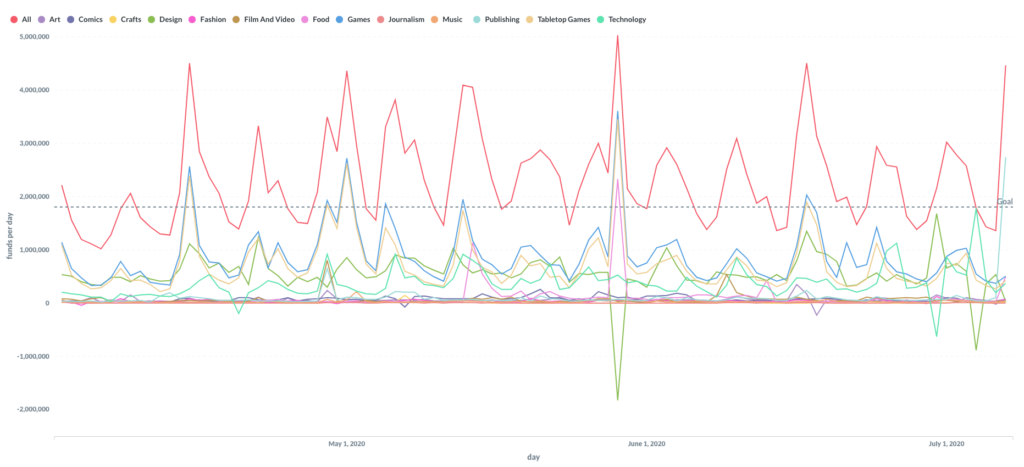
The red line in the graph shows the total number of pledges raised across all project categories. The dotted “Goal” line is the average funds raised in 2019.
Between each large red spike, there are small dips below the goal line which is typical for pledges to dip as we head into the weekend, and pick back up during the weekday. Overall, the dips have been getting more shallow as the year progresses.
The few sharp dips below the x-axis are happening because sometimes campaigns switch project categories.—you can see where there are downward dips, there is an inverse of the same size above the x-axis.
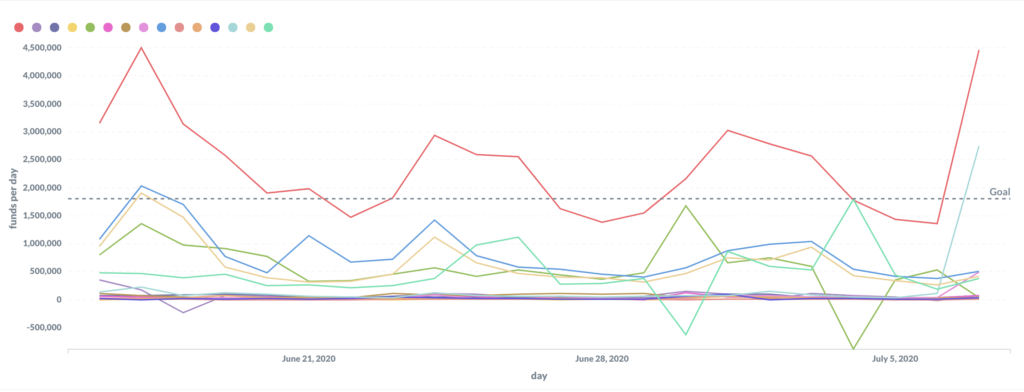
Three categories did particularly well in gathering backer pledges in the past several weeks:
- Games (in blue) on June 17, with big projects like Overlord: a Boss Monster Adventure live having launched that week.
- Design (in lime green) on June 30, with What does Outer Space smell like? NASA designed Fragrance. picking up steam around that time.
- Technology (in teal) did equally as well this past holiday weekend, with REVORING: A Variable Step Ring for your Camera Lens Filters as one of the trending campaigns leading the way for July.
Based on these trends, it looks like it’s still a great time to run a campaign. Since April, we’ve covered how coronavirus is affecting the crowdfunding space and how now is still a good time to launch your campaign.
Will there be a 16th week streak of rising pledges? Stay tuned for next week…
In the meantime, download the BackerTracker Chrome Extension or Firefox Add-on to directly see on the campaign page where a project is trending.
—
During these uncertain times, a lot of people are asking us how the Coronavirus pandemic is affecting crowdfunding. Leveraging our strong crowdfunding connections and unique data insights, we’re able to track crowdfunding trends like no other. We will share all of our findings directly to the community as they develop.
Have a tip or see a pattern we’re seeing? Please reach out at [email protected]
Until next time, take care of yourself and each other.