We head into our tenth week of crowdfunding pledges tracking above better than the average amount of pledges raised. This past week’s pledge amount was not as high as previous weeks, but the total amount pledged continues to trend upwards since we’ve started tracking the beginning of April. Since then, we’ve covered how coronavirus is affecting the crowdfunding space and how now is still a good time to launch your campaign.
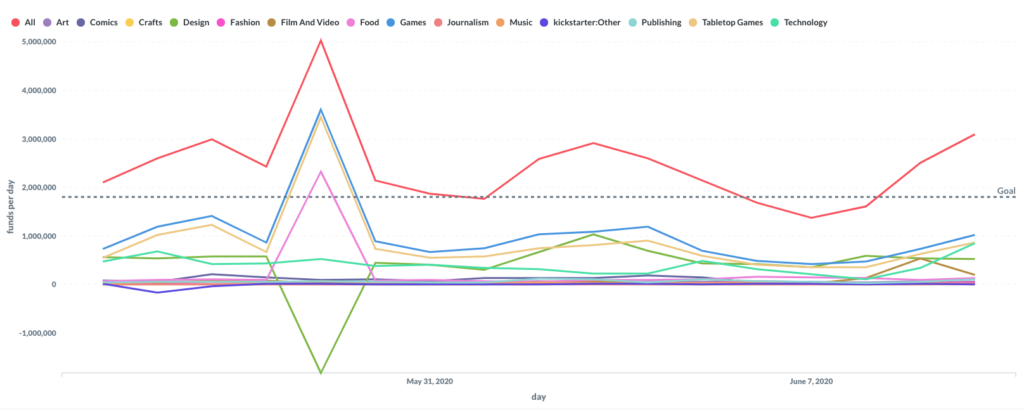
The red line in the graph shows the total number of pledges raised across all project categories. The dotted “Goal” line is the average funds raised in 2019. Between each large red spike, there are small dips below the goal line which is typical for pledges to dip as we head into the weekend, and pick back up during the weekday. Overall, the dips have been getting more shallow as the year progresses.
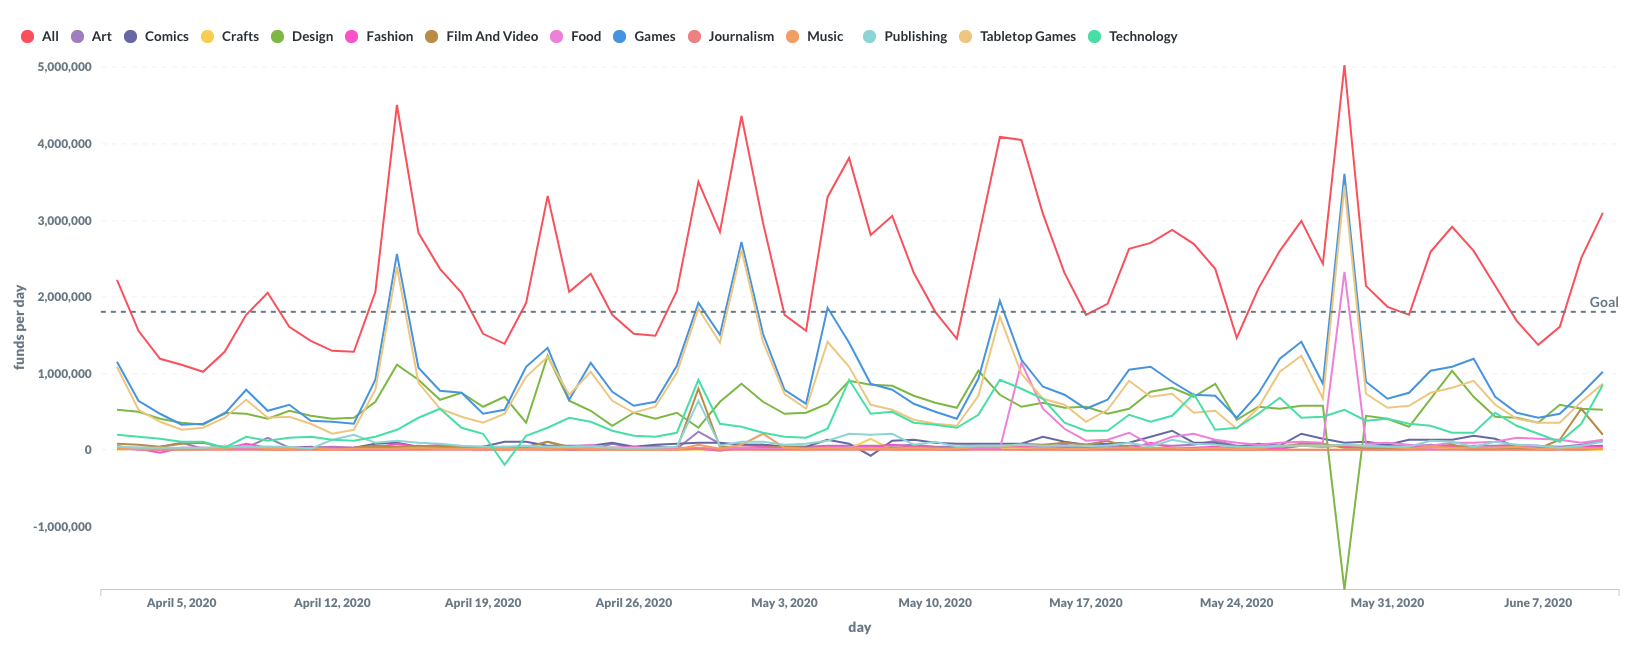
What is that green sharp dip in the chart? Sometimes, campaigns switch project categories. The green line represents the pledge amount raised on May 29 in the Design category, which very closely mirrors the size of the spike in the Food category (in pink) that same day. The pledge amount raised for the Design category was most likely switched to the Food category after a project(s) made the category change.
Will there be a 11th week streak of rising pledges? Stay tuned for next week…
In the meantime, download the BackerTracker Chrome Extension or Firefox Add-on to directly see on the campaign page where a project is trending.
—
During these uncertain times, a lot of people are asking us how the Coronavirus pandemic is affecting crowdfunding. Leveraging our strong crowdfunding connections and unique data insights, we’re able to track crowdfunding trends like no other. We will share all of our findings directly to the community as they develop.
Have a tip or see a pattern we’re seeing? Please reach out at [email protected]
Until next time, take care of yourself and each other.